Study: consumer insights and brand preferences in motorcycle P&A purchases
This article was written by Tristin Burdick, research analyst for EPG Specialty Information, the parent company of Powersports Business.
The direction of any industry is largely guided by consumer preferences, and the powersports sector is no exception. As part of our market research initiatives, we have carried out extensive surveys with members of our MyVoiceRewards consumer panel. Our aim has been to gain a deep understanding of purchasing patterns, consumer behavior, the motivations behind these purchases, and, importantly, brand preferences. This article presents the findings from our research, offering a comprehensive insight into consumer interactions in the marketplace, with a specific focus on the acquisition of motorcycle parts.
A look into ownership
The first step in our research was identifying motorcycle ownership among research participants. A significant portion of respondents own one motorcycle (42%), followed by two motorcycles per respondent (29%). This suggests that a large portion of consumers that own motorcycles are deeply invested in this sport or lifestyle.
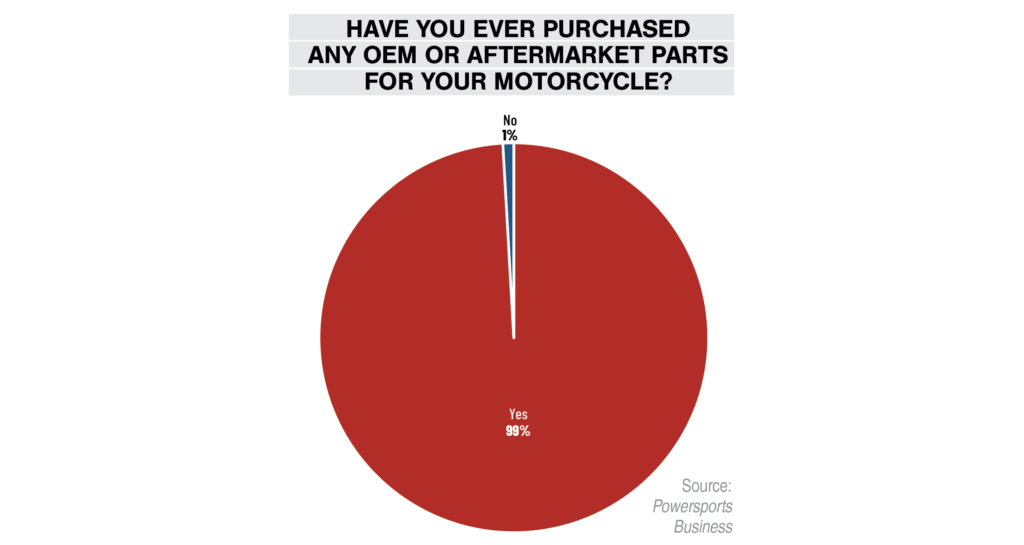
Moreover, a nearly unanimous percentage (99%) of the respondents have purchased OEM (Original Equipment Manufacturer) or aftermarket parts for their motorcycles. This underscores the consumers’ active engagement with the maintenance and customization of their machines, further enriching the powersports marketplace overall.
These findings position motorcycle owners not just as riders but also as caretakers of their machines, directly influencing the demand and trends in the powersports parts market.
Preferences in motorcycle part categories
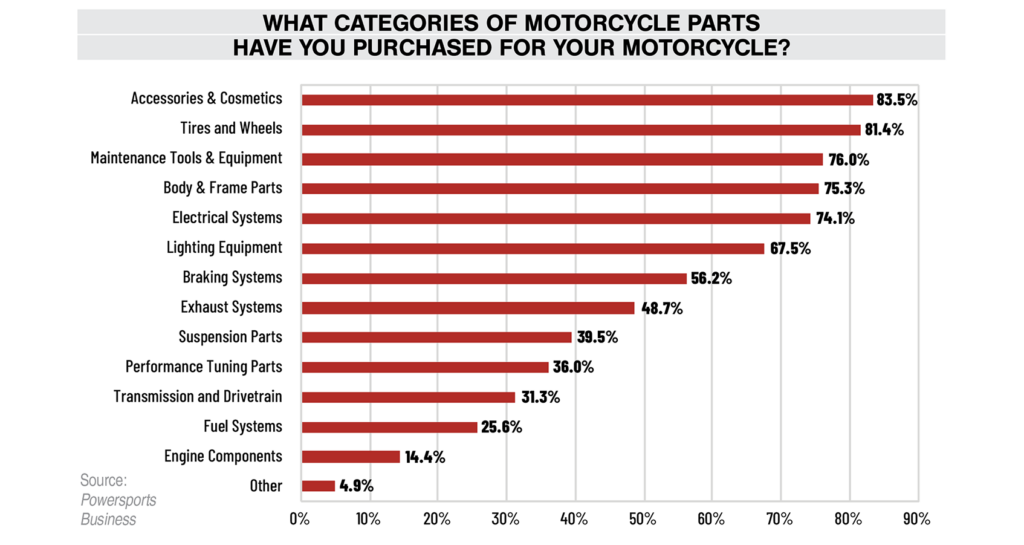
When it comes to enhancing the performance and aesthetics of their motorcycles, the consumer choices are as varied as the types of motorcycles they own. Our survey reveals that the market for motorcycle parts is extensive, with purchases spanning several categories.
The most sought-after part categories include accessories & cosmetics at 84%—incorporating elements such as saddlebags, decals, mirrors, and more—followed by tires & wheels at 82%, encompassing items like tires, rims, spokes. Maintenance tools & equipment are also popular with a significant 76% of respondents purchasing items like motorcycle lifts, chain lube, torque wrenches, and others. Body & frame parts and electrical systems were close behind at 75% and 74%, respectively, followed by lighting equipment at 68%.
Furthermore, the survey asked respondents about their preferred retail outlets for purchasing these parts, i.e., from OEM or aftermarket sources, or a mix of both. Most consumers seemed flexible, willing to purchase from both OEM and aftermarket channels. However, a discernible inclination toward OEM channels emerged when purchasing critical components such as engine components and fuel systems. If given a choice, respondents were more likely to opt for OEM for these essential parts.
Spending trends in motorcycle part categories
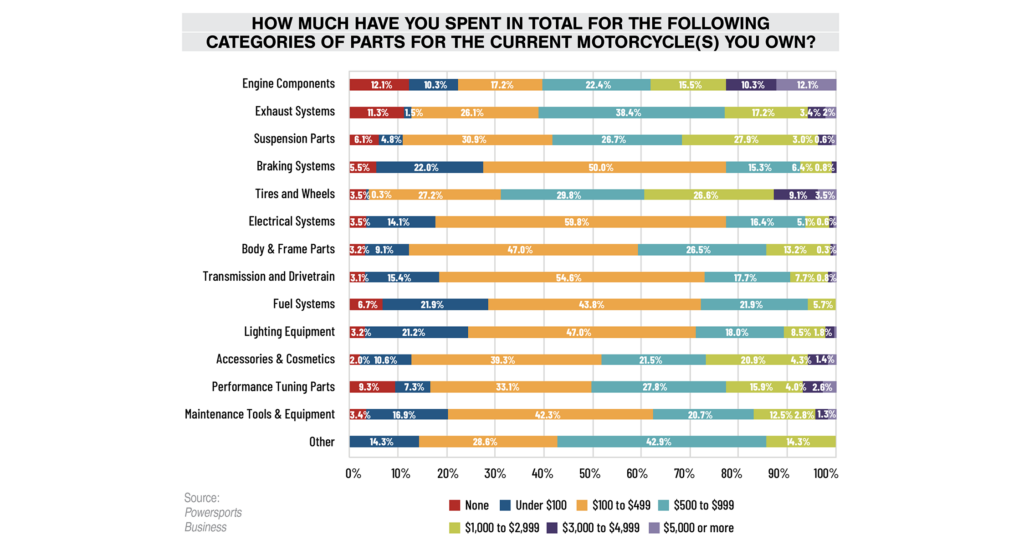
Unveiling the dynamics of the powersports consumer, our survey also provides an in-depth look at the spending habits of motorcycle owners. Notably, the majority of the total lifetime spend for each part category (exhaust systems, suspension parts, braking systems, tires, fuel systems, and 9 other categories) falls between the $100-$499 price range, representing a significant chunk of the average consumer’s investment in their motorcycle’s upkeep and enhancement.
As expected, part categories that typically experience the most wear and tear, such as suspension parts, tires, and engine components, accounted for higher total costs. A more detailed analysis shows 12% of respondents spending over $5,000 on engine components and 27% spending between $500-$999 on suspension parts, highlighting the substantial investments made towards maintaining optimal motorcycle performance.
An annual spending snapshot reveals a similar trend. Tires & wheels, braking systems, electrical systems, and maintenance tools were the categories with the most expenditure in the past 12 months. In contrast, expenditures on engine components, exhaust systems, and performance tuning parts were relatively low, reflecting their long-lasting nature and reduced frequency of replacement (compared to other part categories with higher wear and tear).
The shopping landscape: where consumers buy motorcycle parts
Next, we wanted to take a look at ‘where’ consumers were buying parts for their motorcycles and their preferred sales channels.
A significant 81% of respondents favor specialty websites such as Revzilla and Cycle Gear for their shopping needs, highlighting the prominence of online platforms in today’s digital shopping ecosystem. Traditional local dealerships still hold substantial appeal, with 75% of respondents choosing them as their go-to for parts purchase.
Online retailers like Amazon and eBay claim a sizeable 63% of respondents’ answers, reinforcing the impact of e-commerce in the sector. The direct approach of shopping from the manufacturers’ websites garners a 38% preference among participants, demonstrating the trust placed in original manufacturers. Auto parts stores, motorcycle shows, expos, and classifieds like Craigslist and Facebook Marketplace cater to the rest, with 26%, 16%, and 15% of consumers shopping from these platforms, respectively.
Key factors influencing purchase decisions
We also found five primary factors that influence consumers’ decisions when purchasing motorcycle parts.
Quality emerged as the leading determinant, underscoring the importance consumers place on durable and reliable parts. Price was the second most influential factor, emphasizing the role of affordability in purchase decisions. Brand recognition was third, indicating the trust that consumers place in known and reputed brands.
Reviews were the fourth contributing factor. In an era where peer opinions can be shared with the click of a button, consumers rely heavily on the experiences of others to inform their purchases. Finally, ease of installation ranked fifth, highlighting the desire for convenience and self-sufficiency among consumers.
Deep dive into specific parts categories
To provide a more detailed understanding of the powersports market, our survey explored brand recognition, preferences, and spending habits for specific part categories including batteries, tires, helmets, and exhaust systems.
Batteries
Yuasa emerged as the most recognizable brand in the battery category, followed by Interstate, Energizer, Shorai, and Odyssey. Quality perception aligned with brand recognition, with Yuasa and Odyssey perceived as having the highest quality. When it comes to spending, 57% of respondents would prefer to spend between $100 and $149 on a new motorcycle battery, with 22% willing to spend between $150 and $199. The majority of respondents (40%) replace their battery every 3-4 years, indicating a significant recurring investment in this category.
Tires
The survey found high brand awareness for motorcycle tires. Dunlop, Michelin, and Bridgestone topped the list of recognized brands, with Michelin, Dunlop, and Pirelli being perceived as offering superior quality. Dunlop was the clear winner when it came to current tire installations. Price, availability, and reviews were the main deciding factors when choosing a tire brand, underscoring the balance consumers seek between cost, convenience, and performance.
Helmets
In the world of helmets, Bell, Shoei, and Arai were the most recognizable brands. Arai, Schuberth, and Shoei were perceived as the highest-quality brands. Notably, despite the perception of quality, HJC was the most frequently worn brand among respondents, followed by Shoei and Bell. This suggests that while brand recognition and perceived quality are important, other factors, potentially price and design, play a crucial role in the final purchase decision.
Exhaust Systems
Among the exhaust system brands, Vance & Hines Exhausts, Cobra, and S&S were the most recognized. However, when it came to perceived quality, Akrapovic, Yoshimura, Vance & Hines, and Rinehart topped the list. The most owned brand in this category was Vance & Hines, suggesting that brand recognition and perceived quality aligned with purchase decisions in this category.
What Does This Mean for Stakeholders?
For manufacturers and retailers, understanding the preferences and behaviors of the powersports consumer is critical. With the knowledge that quality and price are top considerations, stakeholders can enhance their value proposition by focusing on providing high-quality parts at competitive prices. Similarly, the emphasis on brand recognition suggests that robust marketing and brand-building efforts can yield significant dividends.
Moreover, with most respondents choosing to shop on specialty websites and local dealerships, businesses could leverage online platforms and local partnerships to improve accessibility and sales. Digital strategies, such as user-friendly websites, targeted ads, and engagement on social media, can enhance brand visibility while collaborating with local dealerships could increase physical reach.
The deep dive into specific part categories sheds light on the dynamics of each segment. Stakeholders can leverage this information to refine their offerings, focusing on aspects that matter most to consumers. For example, in the battery segment, the frequent replacement cycle indicates a continuous demand that businesses can cater to.
Finally, the willingness of consumers to pay within certain ranges for specific parts allows stakeholders to better price their products and services, ensuring competitiveness while maintaining profitability.
These findings offer a roadmap for stakeholders in the powersports market. By understanding consumer preferences and adapting to them, businesses can strengthen their position in this competitive landscape, driving customer satisfaction, loyalty, and ultimately, business success.
This survey was conducted with members of EPG’s MyVoiceRewards consumer panel. To see the full survey results, visit: tinyurl.com/he8hvcra.

