BRP reports Q3 results, sales drop in North America
BRP Inc. recently reported its financial results for the three- and nine-month periods ended October 31, 2024. All financial information is in Canadian dollars unless otherwise noted. The complete financial results are available on the Quarterly Reports section of BRP’s website.

“Our disciplined execution allowed us to deliver results above expectations despite the industry’s macroeconomic context and promotional intensity. We were the first powersports OEM to prioritize network inventory depletion, and we are on track to deliver on our objective to reduce levels by 15% to 20% by the end of the current fiscal year. Driven by our second-to-none product line-ups, our solid dealer network, and improved inventory position, we are uniquely placed to capture opportunities when the market rebounds,”
-José Boisjoli, BRP president and CEO
Boisjoli says they have doubled their core powersports activities to protect long-term growth and solidify their market share. “We are investing to continue pushing technologies and innovation, and consumers can expect an exciting pipeline of new products in the coming years,” he concludes.
Third-quarter results
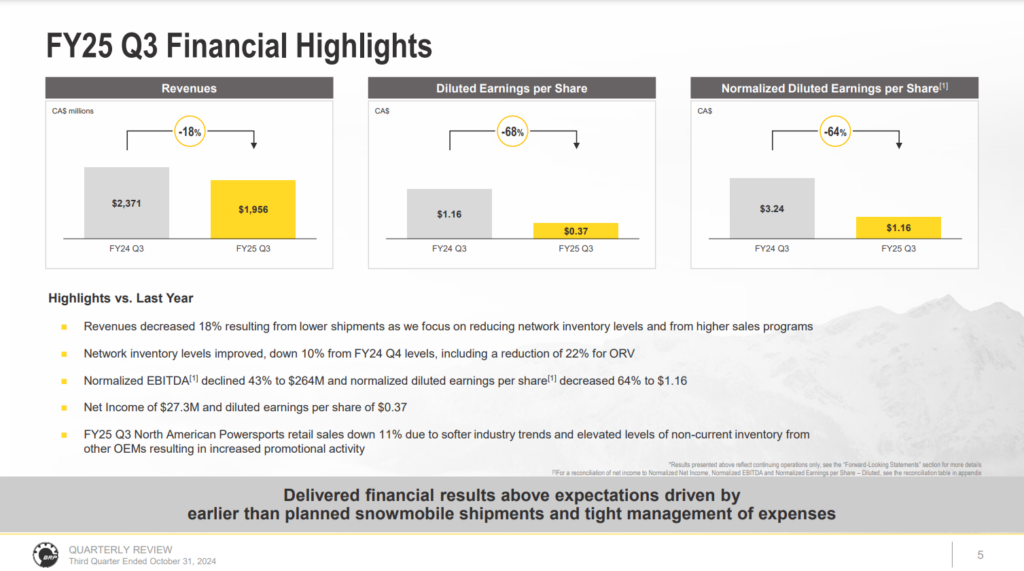
In the context of softer demand and BRP’s focus on reducing network inventory levels during the three months ending October 31, 2024, revenues declined compared to last year. The decrease in the volume of shipments, the higher promotional intensity, and the decreased leverage of fixed costs due to reduced production have led to a decrease in the gross profit margin compared to last year. Favorable pricing, production efficiencies, and optimized distribution costs partially offset this decrease.
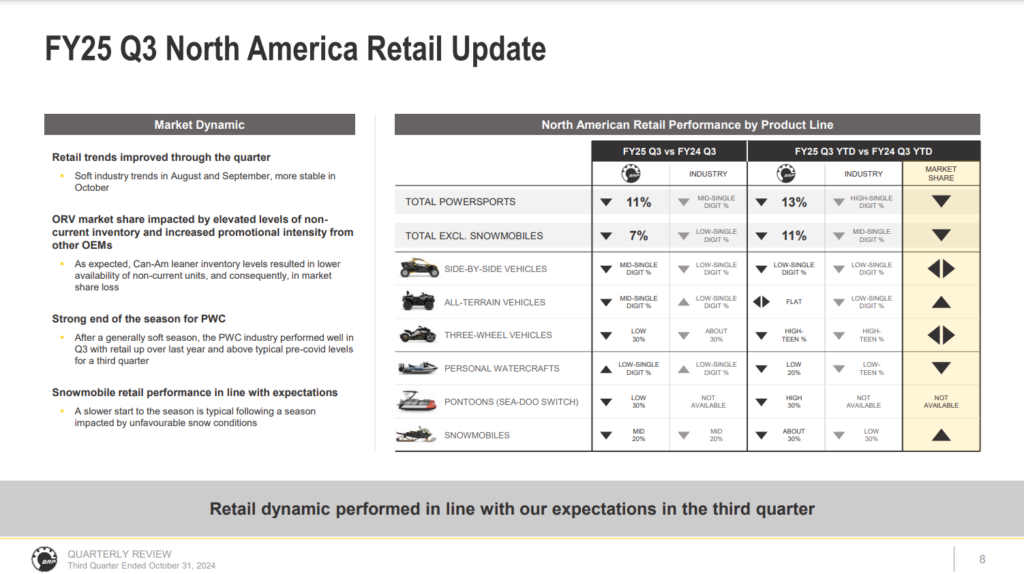
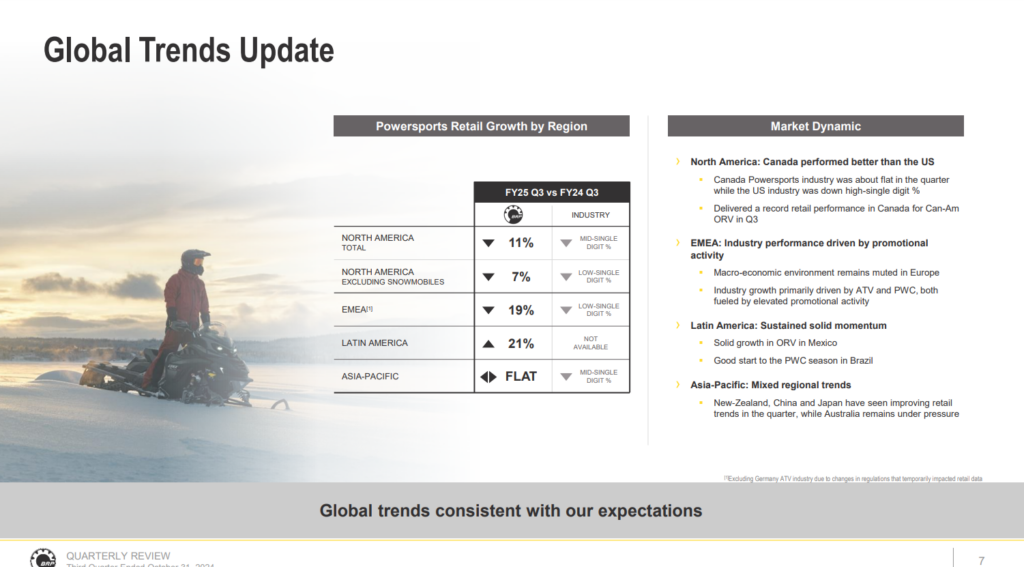
BRP’s North American quarterly retail sales were down 11% in Q3. The decrease is mainly explained by softer demand for its Seasonal and Year-Round Products.
Revenues
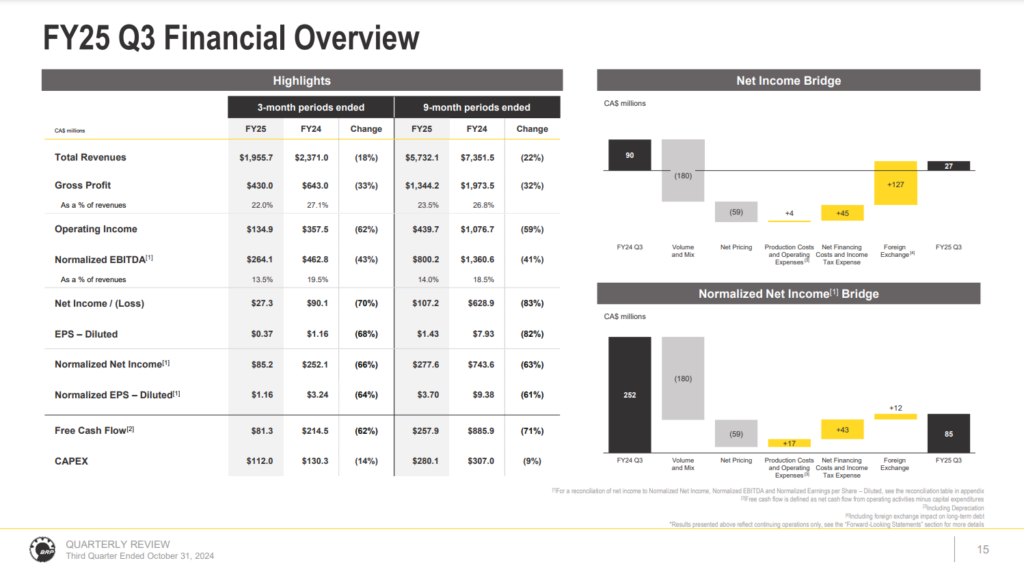
Revenues decreased by $415.3 million, or 17.5%, to $1,955.7 million in Q3, compared to $2,371.0 million in Q3 2023. The decrease in revenues was primarily due to a lower volume sold across all product lines as a result of softer demand and continued focus on reducing network inventory levels, and higher sales programs. The decrease includes a favorable foreign exchange rate variation of $15 million.
Year-Round Products (53% of Q3-FY25 revenues): BRP’s Year-Round Products decreased by $144.2 million, or 12.2%, to $1,036.4 million in Q3. The decrease in revenues resulted from softer demand, continued focus on reducing network inventory levels, and higher sales programs. The decrease was partially offset by a favorable product mix in SSV and pricing across all product lines.
Seasonal Products (32% of Q3-FY25 revenues): Seasonal Products decreased by $252.8 million, or 29.1%, to $615.9 million in Q3, compared to $868.7 million in 2023. The decrease was partially offset by favorable pricing on Snowmobile and PWC.
PA&A and OEM Engines (15% of Q3-FY25 revenues): Revenues from PA&A and OEM Engines decreased by $18.3 million, or 5.7%, to $303.4 million in Q3, compared to $321.7 million in 2023. The decrease in revenues from PA&A and OEM engines was primarily attributable to a lower volume sold due to a high network inventory level in Snowmobile and a decrease in retail in other product lines. The decrease was partially offset by favorable pricing on PA&A.
North American Retail Sales
BRP’s North American retail sales decreased by 11% in Q3-24 compared to the same period last year. The decrease is mainly explained by softer demand for both Seasonal and Year-Round Products. North American Year-Round Products retail sales decreased on a percentage basis in the high-single digits compared to 2023. The North American Year-Round Products industry decreased on a percentage basis in the low-single digits over the same period. North American Seasonal Products retail sales decreased on a percentage basis in the mid-teens range compared to 2023. The North American Seasonal Products industry decreased on a percentage basis in the mid-teens range over the same period.
Operating Expenses
Operating expenses increased by $9.6 million, or 3.4%, to $295.1 million in Q3 compared to $285.5 million in 2023. Operating expenses increased due to higher restructuring and reorganization costs and impairment charges taken on unutilized assets. Lower R&D expenses partially offset the increase. The increase in operating expenses includes a favorable foreign exchange rate variation of $3 million.
Net Income
Net income decreased by $62.8 million, or 69.7%, to $27.3 million in Q3, compared to $90.1 million in 2023. The decrease in net income was primarily due to a lower operating income resulting from a lower gross margin. Lower financing costs, a favorable foreign exchange rate variation on the U.S.-denominated long-term debt, and a lower income tax expense partially offset the decrease.
Nine-month results
Revenues decreased by $1,619.4 million, or 22.0%, to $5,732.1 million for the nine months, compared to $7,351.5 million in 2023. The decrease in revenues was primarily due to a lower volume sold across all product lines as a result of softer demand and continued focus on reducing network inventory levels, and higher sales programs. The decrease was partially offset by a favorable product mix across most product lines and favorable pricing across most product lines. The decrease includes a favorable foreign exchange rate variation of $61 million.
Net Income
Net income decreased by $521.7 million to $107.2 million for the nine months, compared to $628.9 million for the nine months in 2023. The decrease in net income was primarily due to lower operating income, resulting from a lower gross margin. Lower financing costs and a lower income tax expense partially offset the decrease.
Consolidated net cash flows generated from operating activities totaled $432.9 million for the nine months ended October 31, 2024, compared to consolidated net cash flows generated from operating activities of $1,053.2 million for the nine months ended October 31, 2023. The decrease was mainly due to lower profitability and unfavorable changes in working capital, partially offset by lower income taxes paid. The unfavorable changes in working capital resulted from maintaining higher provisions, reflecting the industry’s promotional intensity and inventory levels.
BRP also invested $299.4 million of its liquidity in capital expenditures to introduce new products and modernize its software infrastructure to support future growth.
BRP’s third-quarter FY25 webcast presentation is posted in the Quarterly Reports section of its website.

