OE vs. Aftermarket: Which side is winning?
By Danny Orendain
This article originally appeared in the September issue of Powersports Business.
Lightspeed DMS sees the powersports parts business at a scale few can match, and that vantage point answers a question most manufacturers and suppliers can only guess at: of every dollar of parts that goes on a given brand of motorcycle, how much is the manufacturer’s own (OE) and how much is aftermarket in the same showroom?
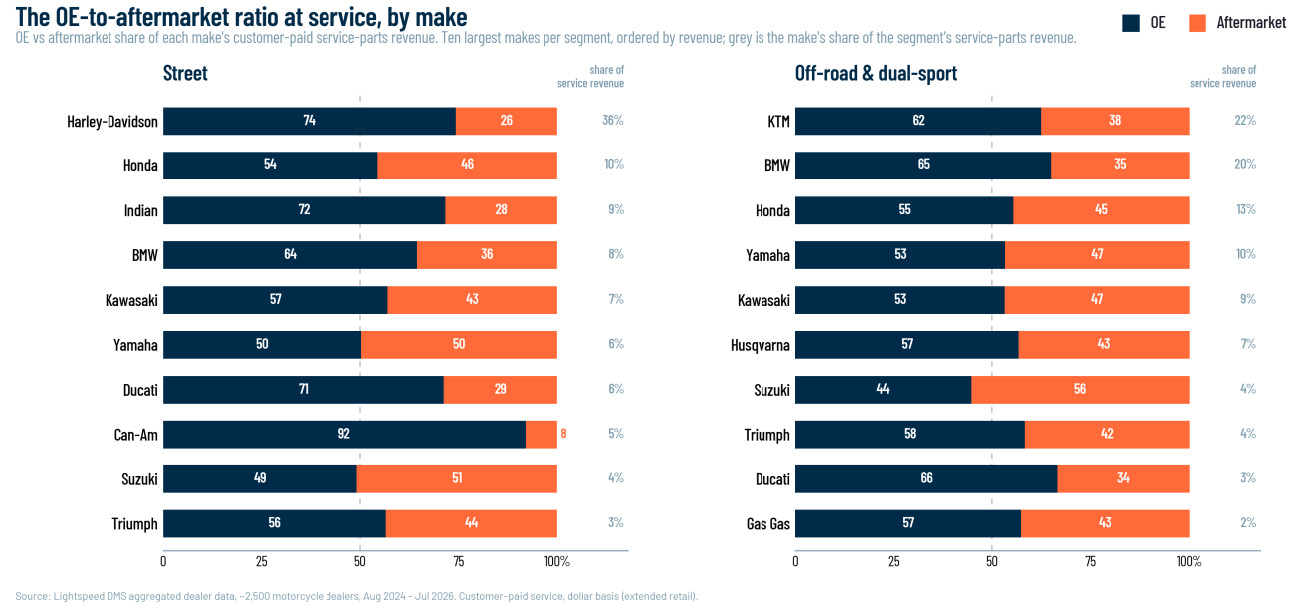
Start in the service bay, where the volume is largest and steadiest (figure below). Measured in parts revenue, the OE-to-aftermarket split runs a remarkably wide spectrum. In aggregate, off-road runs more aftermarket, 41% of service-parts revenue against 32% on the street, but that is mostly a mix effect rather than a difference in how any one brand behaves: Harley-Davidson alone accounts for 36% of street service-parts revenue at just 26% aftermarket, and setting it aside lifts the street figure to 36%.
At the time of the unit sale, the field splits much harder (figure below). The Japanese brands pull away: on a Yamaha or a Suzuki, roughly 70% of the street accessory revenue at delivery is aftermarket, and off-road Kawasaki and Yamaha run 67 and 65%. Several premium and touring models move the opposite way and end up almost entirely OE, with Ducati at about 5% aftermarket on the street and BMW, Triumph, and Ducati all in the single digits off-road. Same showroom, and a completely different accessory business depending on the franchise on the board.
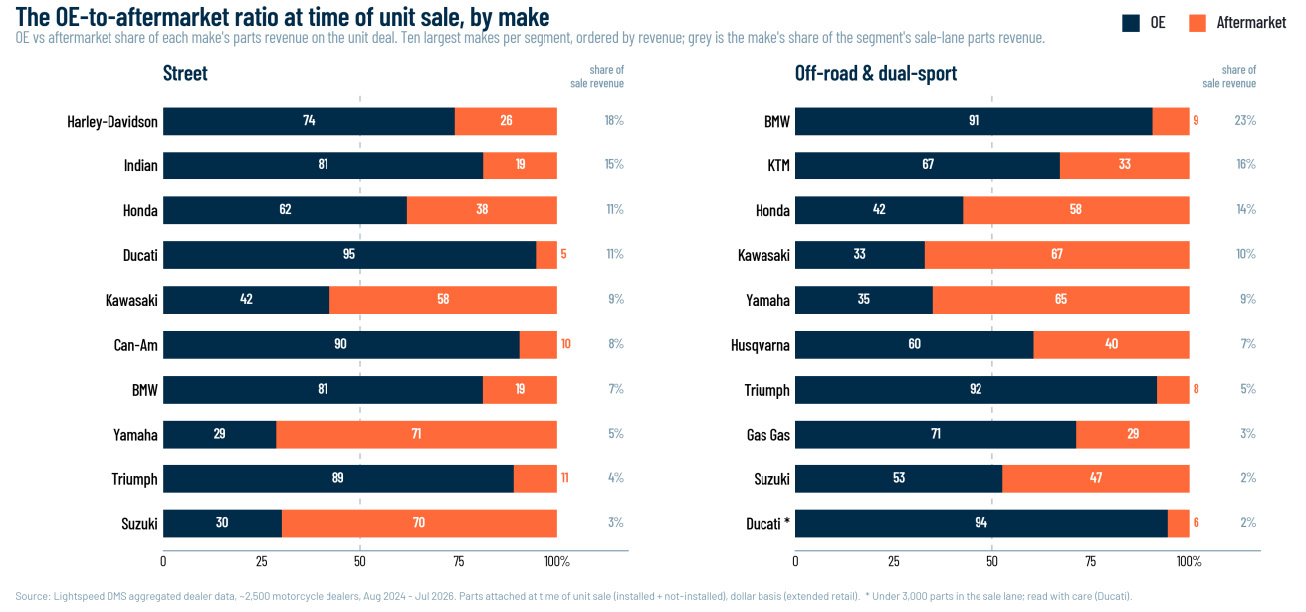
The brand split also sheds light on something potentially surprising. Segment-wide, the aftermarket takes a larger share of the parts dollars in the service bay than in the showroom: about 32% of street service-parts revenue against 27% at delivery, and 41% against 37% off-road. Part of the reason is mix. The OE-loyal touring and premium brands account for roughly two-thirds of street accessory revenue at delivery, while Yamaha, Suzuki, and Kawasaki together account for under a fifth, so the sales-lane average lands well below what Yamaha and Suzuki alone would suggest.
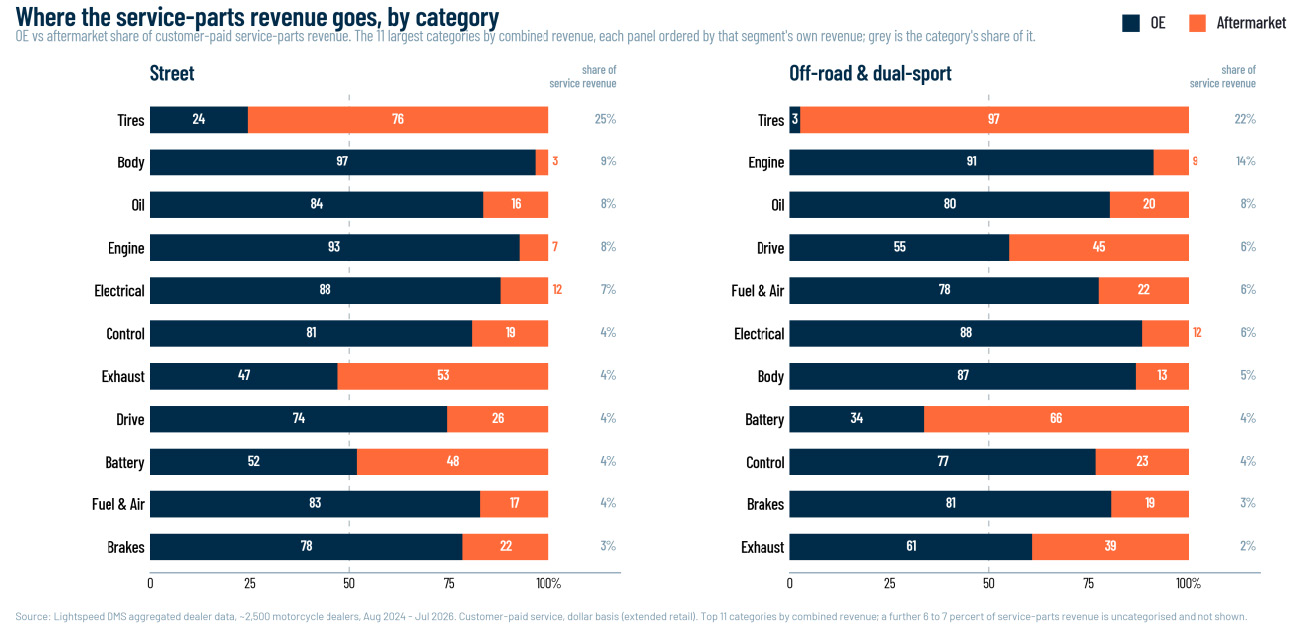
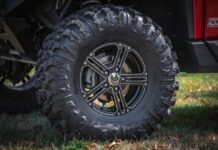
The ratio is not only a brand story; it is also a parts story, and in revenue terms, it is concentrated (figure above). Tires are the single largest service category in both segments, about 25% of street service-parts revenue and 22% of off-road, and they are overwhelmingly aftermarket. At the other end, engine, body, electrical, and oil revenue stays roughly 80% to 97% OE. For a supplier, that is a map of where the openings are; for a manufacturer, it is a list of the categories being lost.
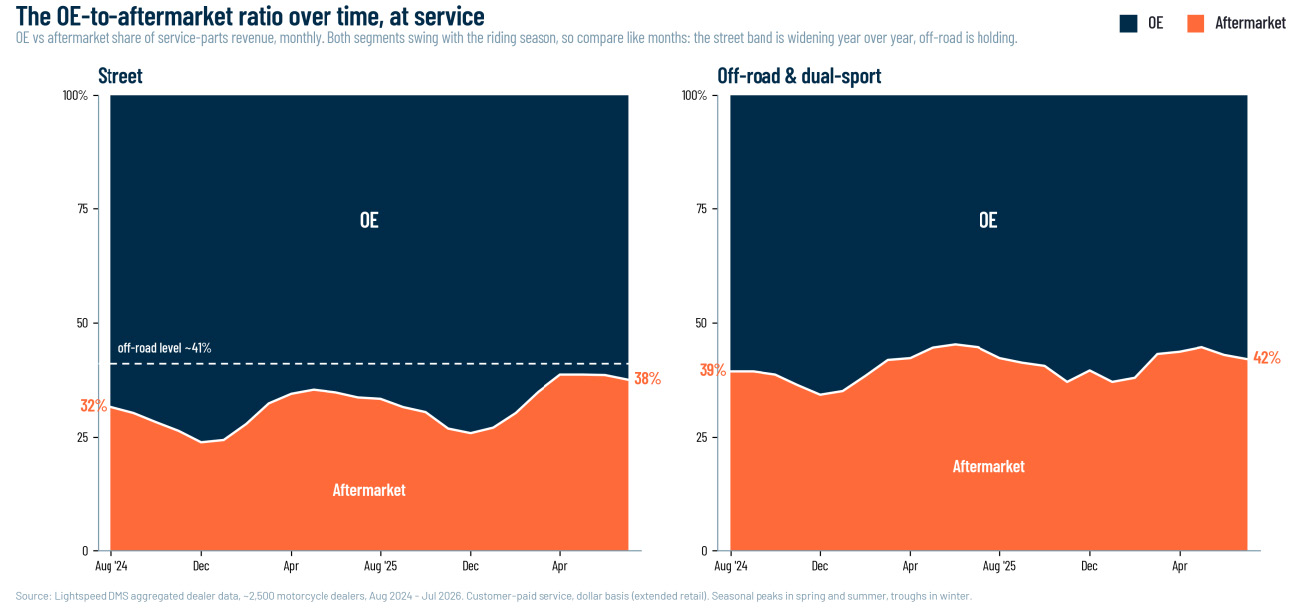
The calendar changes the ratio because it changes the work (figure above). The off-season fills the bench with repair and rebuild jobs that run almost entirely OE. Body work alone climbs from about 7% of street service-parts revenue in season to 13% between November and January, at roughly 3% aftermarket. In season, the mix tilts back toward wear replacement, which the aftermarket dominates. Hold that mix constant and the seasonal swing shrinks from about 15 points to 6 points. Compare like quarters, and the trend is clear: in the April-to-June quarter, the aftermarket took 38.7% of street service-parts revenue against 34.9% a year earlier, the highest of any quarter in the series, while off-road held flat. The season explains the wobble; the street business explains the direction.