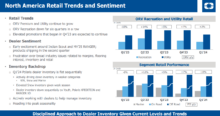
BRP grows North American retail 16 percent in fiscal Q2
BRP today reported its fiscal year 2019 second quarter results, and the highlights were aplenty:
- Strong momentum in North America powersports retail; up 16%, outpacing the industry;
- Revenues of $1,207.0 million, an increase of $183.9 million or 18.0%;
- Gross profit of $280.1 million representing 23.2% of revenues, an increase of $64.1 million or 210 basis points;
- Normalized EBITDA[1] of $144.2 million representing 11.9% of revenues, an increase of $60.5 million;
- Net income of $41.0 million, a decrease of $63.0 million, which resulted in a diluted earnings per share of $0.41, a decrease of $0.52 per share;
- Normalized net income[1] of $66.4 million, an increase of $43.5 million, which resulted in a normalized diluted earnings per share[1] of $0.66, an increase of $0.46 per share;
- Increase in guidance for end-of-year with Normalized EPS growth of 30% to 35% compared to last year.
Subsequent event:
On August 28, 2018, acquisition of 100% of Triton Industries Inc. (“Triton”) for a purchase consideration of U.S. $78.5 million ($101.4 million).
BRP Inc. (TSX:DOO) today reported its financial results for the three- and six-month periods ended July 31, 2018. All financial information is in Canadian dollars unless otherwise noted.
“We outpaced the North American powersports industry with 16% growth in retail this quarter. Our Side-by-Side vehicle retail growth continued to be robust and with the great summer we’ve had, our Sea-Doo PWC retail was very strong in all markets. Based on the solid first half of the year and a positive outlook for the remaining six months, we are comfortable increasing our guidance with a normalized EPS growth rate of 30% to 35% for FY19, despite inflationary and other headwinds,” said José Boisjoli, president and CEO.
Boisjoli added, “We are now in the fourth year of our 2020 challenge, and the alignment of the BRP team around our Growth, Agility and Lean objectives is well-demonstrated by the healthy results we are delivering. Given this momentum, we expect to achieve our objective to deliver at least $3.50 of normalized EPS in FY20, one year earlier than initially planned.”
Highlights for the Three- and Six-Month Periods Ended July 31, 2018
Revenues increased by $183.9 million, or 18.0%, to $1,207.0 million for the three-month period ended July 31, 2018, compared with $1,023.1 million for the corresponding period ended July 31, 2017. The revenue increase was mainly due to higher wholesale in Year-Round Products and Seasonal Products, partially offset by an unfavorable foreign exchange rate variation of $7 million.
The Company’s North American retail sales for powersports vehicles and outboard engines increased by 14% for the three-month period ended July 31, 2018 compared with the three-month period ended July 31, 2017, mainly due to an increase in PWC and SSV sales.
As at July 31, 2018, North American dealer inventories for powersports vehicles and outboard engines increased by 8% compared to July 31, 2017.
Gross profit increased by $64.1 million, or 29.7%, to $280.1 million for the three-month period ended July 31, 2018, compared with $216.0 million for the corresponding period ended July 31, 2017. The gross profit increase includes a favourable foreign exchange rate variation of $5 million. Gross profit margin percentage increased by 210 basis points to 23.2% from 21.1% for the three-month period ended July 31, 2017. The increase was primarily due to a higher volume of SSV sold, a favorable product mix and pricing and a favorable foreign exchange rate variation, partially offset by higher production costs.
Operating expenses increased by $8.4 million, or 5.0%, to $177.3 million for the three-month period ended July 31, 2018, compared with $168.9 million for the three-month period ended July 31, 2017. This increase was mainly attributable to higher selling and marketing expenses.
Revenues increased by $343.7 million, or 17.2%, to $2,343.7 million for the six-month period ended July 31, 2018, compared with $2,000.0 million for the corresponding period ended July 31, 2017. The revenue increase was primarily attributable to higher wholesale of Year-Round Products and Seasonal Products, partially offset by an unfavorable foreign exchange rate variation of $19 million.
The Company’s North American retail sales for powersports vehicles and outboard engines increased by 12% for the six-month period ended July 31, 2018 compared with the six-month period ended July 31, 2017, mainly due to an increase in SSV and PWC.
Gross profit increased by $118.6 million, or 26.8%, to $561.7 million for the six-month period ended July 31, 2018, compared with $443.1 million for the corresponding period ended July 31, 2017. The gross profit increase includes a favorable foreign exchange rate variation of $1 million. Gross profit margin percentage increased by 180 basis points to 24.0% from 22.2% for the six-month period ended July 31, 2017. The increase was primarily due to a higher volume of SSV and PWC sold and a favorable product mix and pricing, partially offset by higher sales program costs and higher production costs.
Operating expenses increased by $37.1 million, or 11.1%, to $372.7 million for the six-month period ended July 31, 2018, compared with $335.6 million for the six-month period ended July 31, 2017. The increase was mainly attributable to higher selling and marketing expenses.
Net Income data
| Three-month periods ended |
Six-month periods ended |
|||
| (in millions of Canadian dollars) | July 31, 2018 |
July 31, 2017 |
July 31, 2018 |
July 31, 2017 |
| Restated [1] | Restated [1] | |||
| Revenues by category [2] | ||||
| Year-Round Products | $554.0 | $440.4 | $1,080.6 | $836.5 |
| Seasonal Products | 384.6 | 316.7 | 735.0 | 641.1 |
| Powersports PAC and OEM Engines | 147.1 | 142.5 | 303.0 | 293.3 |
| Marine Engines, Boats and PAC | 121.3 | 123.5 | 225.1 | 229.1 |
| Total Revenues | 1,207.0 | 1,023.1 | 2,343.7 | 2,000.0 |
| Cost of sales | 926.9 | 807.1 | 1,782.0 | 1,556.9 |
| Gross profit | 280.1 | 216.0 | 561.7 | 443.1 |
| As a percentage of revenues | 23.2% | 21.1% | 24.0% | 22.2% |
| Operating expenses | ||||
| Selling and marketing | 79.0 | 72.0 | 162.0 | 142.5 |
| Research and development | 51.0 | 48.5 | 106.6 | 98.6 |
| General and administrative | 49.1 | 44.1 | 97.8 | 87.6 |
| Other operating expenses (income) | (1.8) | 4.3 | 6.3 | 6.9 |
| Total operating expenses | 177.3 | 168.9 | 372.7 | 335.6 |
| Operating income | 102.8 | 47.1 | 189.0 | 107.5 |
| Net financing costs | 26.3 | 12.7 | 37.8 | 24.5 |
| Foreign exchange (gain) loss on long-term debt | 17.3 | (81.8) | 58.8 | (37.6) |
| Income before income taxes | 59.2 | 116.2 | 92.4 | 120.6 |
| Income tax expense | 18.2 | 12.2 | 38.0 | 21.5 |
| Net income | $41.0 | $104.0 | $54.4 | $99.1 |
| Attributable to shareholders | $40.7 | $103.9 | $54.0 | $98.8 |
| Attributable to non-controlling interest | $0.3 | $0.1 | $0.4 | $0.3 |
| Normalized EBITDA [3] | $144.2 | $83.7 | $270.8 | $184.3 |
| Normalized net income [3] | $66.4 | $22.9 | $119.9 | $65.7 |
| [1] | Restated to reflect the adoption of IFRS 15 “Revenue from contracts with customers” and IFRS 9 “Financial instruments” standards as explained in Note 19 of the unaudited condensed consolidated interim financial statements for the three- and six-month periods ended July 31, 2018. |
| [2] | Comparative figures have been modified to reflect the new categories of revenues following the acquisition of Alumacraft and the creation of the Marine Group. |
| [3] | See “Non-IFRS Measures” section. |
QUARTERLY REVIEW BY SEGMENT
Powersports
Year-Round Products
Revenues from Year-Round Products increased by $113.6 million, or 25.8%, to $554.0 million for the three-month period ended July 31, 2018, compared with $440.4 million for the corresponding period ended July 31, 2017. The increase resulted mainly from a higher volume and a favorable product mix of SSV sold, partially offset by an unfavorable foreign exchange rate variation of $4 million.
North American Year-Round Products retail sales increased on a percentage basis in the high-teen range compared with the three-month period ended July 31, 2017.
Seasonal Products
Revenues from Seasonal Products increased by $67.9 million, or 21.4%, to $384.6 million for the three-month period ended July 31, 2018, compared with $316.7 million for the corresponding period ended July 31, 2017. The increase was driven by a higher volume and a favorable product mix of PWC sold and from a favorable product mix of snowmobiles sold.
North American Seasonal Products retail sales increased in the mid-teen range compared with the three-month period ended July 31, 2017.
Powersports PAC and OEM Engines
Revenues from Powersports PAC and OEM Engines remained stable at $147.4 million for the three-month period ended July 31, 2018, compared with $143.4 million for the corresponding period ended July 31, 2017.
Marine
Marine Engines, Boats and PAC
Revenues from Marine Engines, Boats and PAC remained stable at $128.8 million for the three-month period ended July 31, 2018, compared with $129.5 million for the corresponding period ended July 31, 2017.
North American outboard engine retail sales increased on a percentage basis by low-single digits compared with the three-month period ended July 31, 2017.
Declaration of dividend
The Company’s Board of Directors declared a quarterly dividend of $0.09 per share for holders of its multiple voting shares and subordinate voting shares. The dividend will be paid on October 12, 2018 to shareholders of record at the close of business on September 28, 2018. The payment of each quarterly dividend remains subject to the declaration of that dividend by the Board of Directors. The actual amount, the declaration date, the record date and the payment date of each quarterly dividend are subject to the discretion of the Board of Directors.
Fiscal Year 2019 Guidance
The table below sets forth BRP’s financial guidance for Fiscal Year 2019 when compared to actual results for Fiscal Year 2018, as revised to reflect the adoption of new IFRS 9 Financial instruments and IFRS 15 Revenue from contracts with customers standards effective as of February 1, 2018. The financial guidance targets have been adjusted as follows:
| Financial Metric | FY18 Results (based on new IFRS standards)[1] |
FY19 Guidance[4] vs FY18 Restated (based on new IFRS standards)[1] |
|
| Revenues[5] | |||
| Year-Round Products | $1,810.0 | Up 18% to 21% (previously up 12% to 15%) |
|
| Seasonal Products | $1,553.9 | Up 9% to 12% (previously up 5% to 10%) |
|
| Powersports PAC and OEM Engines | $659.7 | Up 3% to 7% (new product category) |
|
| Marine Engines, Boats and PAC | $428.9 | Up 15% to 20% (new product category) |
|
| Total Company Revenues | $4,452.5 | Up 12% to 16% (previously up 6% to 10%) |
|
| Normalized EBITDA[2] | $536.2 | Up 20% to 22% (previously up 17% to 19%) |
|
| Effective Tax Rate[2][3] | 26.9% | 26.5% – 27.5% | |
| Normalized Earnings per Share – Diluted[2] | $2.27 | Up 30% to 35% ($2.94 to $3.06) (previously up 24% to 30%) |
|
| Net Income | 239.1 | $230M to $240M (assuming an Fx loss on long-term debt of $58.8M) |
Other guidance:
- Expecting ~$175M of Depreciation Expense compared to $149M in FY18, ~$63M of Normalized Net Financing Costs (increased from ~$62M) and ~100.0M shares (decreased from ~100.5M)
- Expecting Capital Expenditures of ~$315M to $330M in FY19 compared to $230M in FY18
[2] See “Non-IFRS Measures” section
[3] Effective tax rate based on Normalized Earnings before Normalized Income Tax
[4] Please refer Forward-Looking Statements at the end of this release for a summary of key assumptions and important risk factors underlying the FY19 guidance
[5] Please refer to Note 5 of the unaudited condensed consolidated interim financial statements for the three- and six-month periods ended July 31, 2018 for futher details on the changes in the categories of revenues.
The above targets are based on a number of economic and market assumptions the Company has made in preparing its Fiscal Year 2019 financial guidance, including assumptions regarding the performance of the economies in which it operates, foreign exchange currency fluctuations, market competition and tax laws applicable to its operations. The Company cautions that the assumptions used to prepare the forecasts for Fiscal Year 2019, although reasonable at the time they were made, may prove to be incorrect or inaccurate. In addition, the above forecasts do not reflect the potential impact of any non-recurring or other special items or of any new material commercial agreements, dispositions, mergers, acquisitions, other business combinations or other transactions that may be announced or that may occur after August 29, 2018. The financial impact of such transactions and non-recurring and other special items can be complex and depends on the facts particular to each of them. We therefore cannot describe the expected impact in a meaningful way or in the same way we present known risks affecting our business. Accordingly, our actual results could differ materially from our expectations as set forth in this news release. The outlook provided constitutes forward-looking statements within the meaning of applicable securities laws and should be read in conjunction with the “Caution Concerning Forward-Looking Statements” and “Key Assumptions” sections.


