Boisjoli ‘very pleased’ with BRP’s fiscal Q3 results
BRP today reported its financial results for the three- and nine-month periods ended Oct. 31. All financial information is in Canadian dollars unless otherwise noted.
“We are very pleased with our results as our strong lineup continues to gain market share globally. The surge in demand for our products has offered a major opportunity for us to continue this pace and we are working hard to maintain it. We expect this positive trend to continue over the next quarter, and based on this, we are increasing our year-end guidance with Normalized EPS now expected to be up 31% to 37% vs. last year,” said José Boisjoli, President and CEO.

“I would also like to thank the remarkable dedication of our employees, dealers and suppliers who have risen to the occasion and allowed us to continue to deliver exceptional results while still ensuring the health and safety of our people everywhere around the world,” concluded Boisjoli.
Highlights for the Three- and Nine-Month Periods Ended Oct. 31, 2020
Revenues increased by $31.1 million, or 1.9%, to $1.674 billion for the three-month period ended Oct. 31, 2020, compared with $1.643 billion for the corresponding period ended Oct. 31, 2019. The revenue increase was mainly driven by lower sales programs due to a favorable retail environment and a favorable product mix, partially offset by a lower volume of products sold due to the replenishment of inventory at International.
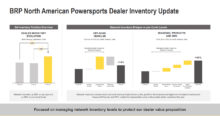
The company’s North American retail sales for powersports vehicles increased by 16% for the three-month period ended Oct. 31, 2020 compared with the three-month period ended Oct. 31, 2019. The increase was driven by Year-Round Products and snowmobile, partially offset by PWC. North American boat retail sales increased by 4% compared with the three-month period ended Oct. 31, 2019.
Gross profit increased by $45.0 million, or 10.2%, to $486.9 million for the three-month period ended Oct. 31, 2020, compared with $441.9 million for the corresponding period ended Oct. 31, 2019. The gross profit increase includes an unfavorable foreign exchange rate variation of $15 million. Gross profit margin percentage increased by 220 basis points to 29.1% from 26.9% for the three-month period ended Oct. 31, 2019. The increase of 220 basis points was primarily due to a positive pricing and sales programs variation due to the favorable retail environment, partially offset by the under-absorption of fixed costs resulting from a lower level of production in Seasonal Products and an unfavorable foreign exchange rate variation.


Operating expenses decreased by $31.3 million, or 13.4%, to $202.6 million for the three-month period ended Oct. 31, 2020, compared with $233.9 million for the three-month period ended Oct. 31, 2019. This decrease was mainly attributable to cost reduction initiatives to mitigate the COVID-19 impact.
Revenues decreased by $299.0 million, or 6.7%, to $4,137.8 million for the nine-month period ended Oct. 31, 2020, compared with $4,436.8 million for the corresponding period ended Oct. 31, 2019. The revenue decrease was primarily attributable to a lower volume of Seasonal Products due to the temporary suspension of production during part of the first half of Fiscal 2021 following government measures adopted in response to COVID-19 and to a lower volume of Marine products sold due to the wind-down of the Evinrude outboard engines production, partially offset by a favorable foreign exchange rate variation of $23 million.
The company’s North American retail sales for powersports vehicles increased by 23% for the nine-month period ended Oct. 31, 2020 compared with the nine-month period ended Oct. 31, 2019, mainly due to an increase in side-by-side and ATV. North American boat retail sales increased by 8% compared with the nine-month period ended Oct. 31, 2019.
Gross profit decreased by $99.9 million, or 9.3%, to $970.4 million for the nine-month period ended Oct. 31, 2020, compared with $1,070.3 million for the corresponding period ended Oct. 31, 2019. The gross profit decrease includes a favorable foreign exchange rate variation of $1 million. Gross profit margin percentage decreased by 60 basis points to 23.5% from 24.1% for the nine-month period ended October 31, 2019. The decrease was primarily due to the under-absorption of fixed costs resulting from the temporary suspension of production, the costs related to the wind-down of the Evinrude outboard engines production and higher labor costs. The decrease was partially offset by a positive pricing and sales programs variation due to the favorable retail environment.
Operating expenses increased by $90.5 million, or 13.6%, to $753.9 million for the nine-month period ended Oct. 31, 2020, compared with $663.4 million for the nine-month period ended Oct. 31, 2019. The increase was mainly attributable to the impairment charge recorded during the first quarter of Fiscal 2021 for the Marine segment and the restructuring costs for a total of $214.5 million, partially offset by cost reduction initiatives to mitigate the COVID-19 impact.
QUARTERLY REVIEW BY SEGMENT
Powersports
Year-Round Products
Revenues from Year-Round Products increased by $78.0 million, or 10.8%, to $803.0 million for the three-month period ended Oct. 31, 2020, compared with $725.0 million for the corresponding period ended Oct. 31, 2019. The increase resulted mainly from lower sales programs due to a favorable retail environment and a favorable product mix in side-by-side and 3-wheel vehicle. The increase was partially offset by a lower volume of side-by-side sold due to the replenishment of inventory at International.
North American Year-Round Products retail sales increased on a percentage basis in the low-thirties range compared with the three-month period ended Oct. 31, 2019.
Seasonal Products
Revenues from Seasonal Products decreased by $46.5 million, or 8.4%, to $508.3 million for the three-month period ended Oct. 31, 2020, compared with $554.8 million for the corresponding period ended Oct. 31, 2019. The decrease was driven by a lower volume of products sold due to a change in the production schedule compare to the third quarter of Fiscal 2020, partially offset by lower sales programs due to favorable retail environment.
North American Seasonal Products retail sales decreased on a percentage basis by high-single digits compared with the three-month period ended Oct. 31, 2019.
Powersports PA&A and OEM Engines
Revenues from Powersports PA&A and OEM Engines increased by $33.3 million, or 14.7%, to $259.9 million for the three-month period ended Oct. 31, 2020, compared with $226.6 million for the corresponding period ended Oct. 31, 2019. The increase was mainly attributable to a higher volume of PA&A coming from strong unit retail sales and higher replacement parts revenue driven by an increase usage of products by consumers.
Marine
Revenues from the Marine segment decreased by $34.0 million, or 23.9%, to $108.4 million for the three-month period ended Oct. 31, 2020, compared with $142.4 million for the corresponding period ended Oct. 31, 2019. The decrease was mainly due to the wind-down of the Evinrude outboard engines production resulting in a lower volume of outboard engines sold.
DECLARATION OF DIVIDEND
The Board of Directors approved a quarterly dividend of $0.11 per share for holders of its multiple voting shares and subordinate voting shares. The dividend will be paid on January 14, 2021 to shareholders of record at the close of business on December 31, 2020. The payment of each quarterly dividend remains subject to the declaration of that dividend by the Board of Directors.
The actual amount, the declaration date, the record date and the payment date of each quarterly dividend are subject to the discretion of the Board of Directors.
Fiscal Year 2021 Guidance
The financial guidance targets have been adjusted as follows:
| Financial Metric | FY20 | FY21 Guidance[3] vs FY20 (vs. Previous Guidance) | |||
| Revenues | |||||
| Year-Round Products | $2,791.7 | Down 2% to up 2% (previously ‘’Flat to down 4%”) | |||
| Seasonal Products | $1,901.4 | Down 2% to 5% (previously ‘’Down 12% to 15%”) | |||
| Powersports PAA and OEM Engines | $799.8 | Up 5% to 7% (previously ‘’Flat to up 5%”) | |||
| Marine | $559.8 | Down 25% to 30% | |||
| Total Company Revenues | $6,052.7 | Down 1% to 5% (previously ‘’Down 5% to 9%”) | |||
| Normalized EBITDA[1] | $804.4 | Up 20% to 24% (previously ‘’Flat to up 5%”) | |||
| Effective Tax Rate[1][2] | 26.1% | 26.0% to 26.5% (previously ‘’26.5%’’) | |||
| Normalized Earnings per Share – Diluted[1] | $3.83 | Up 31% to 37% ($5.00 to $5.25) (previously ‘’$3.65 to $3.95”) | |||
| Net Income | 370.6 | $225M to $250M |
Other assumptions for FY21 Guidance:
- Depreciation expense: ~$260M
- Net Financing Costs Adjusted: ~$105M
- Weighted average number of shares – diluted: ~89M shares
- Capital Expenditures: ~$275M to $300M
[1] Please refer to “Non-IFRS Measures” section.
[2] Effective tax rate based on Normalized Earnings before Normalized Income Tax.
[3] Please refer to the “Caution Concerning Forward-Looking Statements” and “Key assumptions” sections of this press release for a summary of important risk factors that could affect the above guidance and of the assumptions underlying this Fiscal Year 2021 financial guidance.
| Net Income data | ||||||||
| Three-month periods ended | Nine-month periods ended | |||||||
| (in millions of Canadian dollars) | October 31, 2020 | October 31, 2019 | October 31, 2020 | October 31, 2019 | ||||
| Revenues by category | ||||||||
| Powersports | ||||||||
| Year-Round Products | $803.0 | $725.0 | $2,064.5 | $2,086.6 | ||||
| Seasonal Products | 508.3 | 554.8 | 1,153.6 | 1,358.7 | ||||
| Powersports PA&A and OEM Engines | 259.7 | 225.7 | 626.0 | 584.4 | ||||
| Marine | 103.7 | 138.1 | 293.7 | 407.1 | ||||
| Total Revenues | 1,674.7 | 1,643.6 | 4,137.8 | 4,436.8 | ||||
| Cost of sales | 1,187.8 | 1,201.7 | 3,167.4 | 3,366.5 | ||||
| Gross profit | 486.9 | 441.9 | 970.4 | 1,070.3 | ||||
| As a percentage of revenues | 29.1 | % | 26.9 | % | 23.5 | % | 24.1 | % |
| Operating expenses | ||||||||
| Selling and marketing | 84.6 | 104.6 | 230.3 | 293.6 | ||||
| Research and development | 66.0 | 60.3 | 163.4 | 173.7 | ||||
| General and administrative | 60.6 | 70.3 | 159.3 | 188.4 | ||||
| Other operating expenses (income) | (8.6 | ) | (1.3 | ) | 23.8 | 7.7 | ||
| Impairment charge | — | — | 177.1 | — | ||||
| Total operating expenses | 202.6 | 233.9 | 753.9 | 663.4 | ||||
| Operating income | 284.3 | 208.0 | 216.5 | 406.9 | ||||
| Net financing costs | 26.0 | 23.8 | 76.7 | 64.1 | ||||
| Foreign exchange (gain) loss on long-term debt | (9.4 | ) | — | (19.6 | ) | 0.4 | ||
| Income before income taxes | 267.7 | 184.2 | 159.4 | 342.4 | ||||
| Income tax expense | 69.0 | 48.9 | 60.7 | 90.0 | ||||
| Net income | $198.7 | $135.3 | $98.7 | $252.4 | ||||
| Attributable to shareholders | $198.8 | $135.6 | $99.1 | $253.0 | ||||
| Attributable to non-controlling interest | $(0.1 | ) | $(0.3 | ) | $(0.4 | ) | $(0.6 | ) |
| Normalized EBITDA [1] | $348.6 | $268.2 | $685.9 | $582.6 | ||||
| Normalized net income [1] | $190.6 | $136.7 | $314.2 | $258.2 |
[1] See “Non-IFRS Measures” section.
| Other Financial data | ||||
| Three-month periods ended | Nine-month periods ended | |||
| (in millions of Canadian dollars, except per share data) | October 31, 2020 | October 31, 2019 | October 31, 2020 | October 31, 2019 |
| Revenues by geography | ||||
| United States | $952.3 | $890.5 | $2,361.9 | $2,465.0 |
| Canada | 298.5 | 281.6 | 626.5 | 712.9 |
| International [1] | 423.9 | 471.5 | 1,149.4 | 1,258.9 |
| $1,674.7 | $1,643.6 | $4,137.8 | $4,436.8 | |
| Weighted average number of shares – basic | 87,690,498 | 89,684,315 | 87,546,386 | 94,157,306 |
| Weighted average number of shares – diluted | 89,607,635 | 90,829,230 | 88,379,007 | 95,121,505 |
| Earnings per share – basic | $2.27 | $1.51 | $1.13 | $2.69 |
| Earnings per share – diluted | 2.22 | 1.49 | 1.12 | 2.66 |
| Normalized earnings per share – basic [2] | 2.17 | 1.53 | 3.59 | 2.75 |
| Normalized earnings per share – diluted [2] | 2.13 | 1.51 | 3.56 | 2.72 |
[1] International is defined as all jurisdictions except the United States and Canada.
[2] See “Non-IFRS Measures” section.