RumbleOn CEO ‘pleased with strong third quarter results’
RumbleOn, Inc (NASDAQ: RMBL) on Monday announced financial results for the three months ended Sept. 30, 2021, with powersports gross profit per unit retailed eclipsing $5,500. Used unit retail sales increased 53% vs. the year-ago quarter.
“We are the nation’s first technology-based omnichannel marketplace in powersports, and we are on a mission to transform the powersports industry,” CEO Marshall Chesrown said. “On a proforma basis, we delivered $392 million in revenue, $89.4 million in total gross profit, and $23.6 million in Adjusted EBITDA in Q3, based on net income of $(22.5) million. Based on our Q3 results and continued momentum we are increasing our guidance ranges for the full year 2021.”
“A key component of our omnichannel strategy is growth in used unit sales and we’re already delivering results. Year-over-year, used retail unit sales were up 53% in Q3 and in September alone, we drove a 65% increase in used retail unit sales. Our cash offer technology brings in high quality used inventory, which attracts more riders and drives more volume in used unit sales, and we are experiencing improved capture rates at our retail locations. By deepening our presence in existing markets and expanding into new markets through strategic acquisitions, we have set the flywheel in motion. This model further strengthens our omnichannel offering and enables us to quickly and effectively gain market share.”
“We are pleased with our strong third quarter results and the progress we have made, but this is only the beginning. We are moving fast and we’re moving with discipline. We are executing on our strategic priorities and are committed to delivering sustainable, long-term value for our shareholders.”
Recent Business Highlights
- Closed its business combination with RideNow on August 31, 2021, becoming the first Omnichannel in powersports.
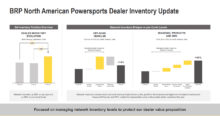
- Began building and deploying inventory management systems to accurately aggregate the data for future accuracy stocking and inventory decisioning.
- Extended its cash offer technology for use in all physical locations, and increased capture rates year-over-year.
- Unveiled proprietary technology in acquiring and processing of used units with reconditioning capabilities, photos via a state-of-the-art and fully automated photo/video capture system.
- Opened a 60,000-square-foot fulfillment center in Orlando, Florida, leveraging its proprietary technology for detailed descriptions and inspections to standardize the online presentation of risk-free purchasing by consumers and dealers.
- Entered into a definitive agreement to acquire powersports retail location in Jacksonville, Florida.
- Entered into a definitive agreement to acquire Freedom Powersports; acquisition will add 13 locations, bringing RumbleOn to Georgia and Alabama and expanding its footprint in Texas.
Third Quarter 2021 Financial Highlights
RumbleOn completed its business combination with RideNow on Aug. 31, 2021. RumbleOn is providing financial results on a GAAP, or “as reported,” basis and on a proforma basis, which assumes the business combination with RideNow closed Jan. 1, 2020. The company has also provided tables with the key operating metrics on both an “as reported” and proforma basis below.


Summary Financial Results, As Reported
On a GAAP basis, RumbleOn’s financial results for the three months ended Sept. 30, 2021, include RideNow’s results for the month of September 2021. Unless otherwise noted, all comparisons are on a year-over-year basis for the three months ended Sept. 30, 2021.
Total vehicle unit sales were 8,518, reflecting an 99.8% increase from 4,263 in Q3 2020. Total powersport unit sales were 5,490, up from 747 in Q3 2020.
Total revenue was $221.2 million, an increase of 88.1% year over year. Total powersports revenue was $105.5 million, up from $7.5 million.
Total gross profit was $37.4 million, up from $16.8 million. Total powersports gross profit accounted for $28.4 million, or more than 75% of gross profit, up from $1.9 million in Q3 2020.
Powersports Gross Profit per Unit Retailed (“powersports GPU”) was $5,542. Powersports Gross Profit per Unit Retailed (“powersports GPU”) is total gross profit from powersport vehicles retailed, inclusive of finance and insurance, net divided by total powersports units sold.
Sales, General, and Administrative Expenses were $37.6 million, compared to $13.3 million in Q3 2020. Advertising and Marketing expense was $4.2 million, compared to $0.8 million in Q3 2020. General and Administrative expense was 16.4 million, compared to $4.3 million in Q3 2020.
Adjusted EBITDA of $3.6 million based on net income of ($22.5 million) compared to $4.7 million on net income of $1.5 million in Q3 2020. Net income in Q3 2021 includes $25.5 million in transaction related costs and compensation expenses, including the vesting of all RSU awards outstanding at the closing of the RideNow Transaction.
Weighted average basic and fully diluted shares outstanding were 6,939,708 in Q3. As of Sept. 30, 2021, RumbleOn had 14,931,522 total shares outstanding.
As of Sept. 30, 2021, RumbleOn had $71.3 million in cash plus cash equivalents, and anticipated access to more than $120 million under term loan facility in Q1 2022.
Summary Financial Results, Proforma
Results provided on a proforma basis includes RideNow’s financial results, assuming the combination was completed as of Jan. 1, 2020.
- Total vehicle unit sales was 16,375, up 7.6% year-over-year. Powersports unit sales was 13,347, up 14.0% year-over-year.
- Total revenue was $391.9 million, up 16.0% year-over-year. Total powersports revenue was $275.0 million, up 21.1% year-over-year.
- Total gross profit was $89.4 million, up 10.2% year-over-year, and powersports gross profit was $80.4 million, up 24.3% year-over-year.
- Powersports GPU was $5,126, up 16.4% year-over-year.
- Sales, General and Administrative Expenses was $69.7 million, or 18.1% of revenue, compared to $53.7 million or 16.0% in Q3 last year. Advertising and Marketing expense was $6.7 million. General and Administrative expense was $19.3 million.
- Total positive Adjusted EBITDA of $23.6 million based on net income of $(22.5) million, as compared to $25.8 million based on net income of $9.7 million in Q3 2020.
Outlook
“We are confident in our ability to exceed the milestones and financial targets we set for the year and are increasing our prior full year 2021 revenue and adjusted EBITDA guidance ranges by approximately 5% at the midpoint. We are executing on our strategic objectives and are excited to share our preliminary expectations for 2022,” concluded Chesrown.
The company is increasing its prior full year 2021 revenue and adjusted EBITDA guidance ranges. Assuming a combination as of Jan. 1, 2021, RumbleOn now expects proforma combined company results as follows:
- Revenue in the range of $1.55 billion to $1.60 billion, an increase of approximately five percent at the midpoint, compared to its prior guidance ranges.
- Adjusted EBITDA in the range of $115.0 million to $120.0 million, an increase of approximately five percent at the midpoint, compared to its prior guidance ranges.
- As a reminder, industrywide, the fourth quarter is the tightest quarter in regards to new inventory due to manufacturer shutdowns during the holidays. This dynamic is assumed in our guidance.
Looking ahead to 2022, RumbleOn expects to deliver year-over-year revenue and adjusted EBITDA growth in the range of 10-15% on an organic basis, driven primarily by an increase in used powersport unit sales supported by RumbleOn Finance. The company anticipates incremental upside to its growth projections from both its pending and potential future acquisitions.
Key Operating Metrics
Powersports Segment
| As Reported | Proforma | |||||
| Q3′ 2021 | Q3′ 2021 | |||||
| Powersports Unit Sales | ||||||
| Total New Powersport Units | 2,485 | 7,524 | ||||
| Retail (Used) | 1,336 | 4,044 | ||||
| Wholesale (Used) | 1,669 | 1,779 | ||||
| Total Used Powersport Units | 3,005 | 5,823 | ||||
| Total Powersport Units Sold | 5,490 | 13,347 | ||||
| Powersports Revenue ($000) | ||||||
| New Powersports Revenue | $42,943 | $126,126 | ||||
| Retail (Used) | 19,926 | 59,052 | ||||
| Wholesale (Used) | 20,422 | 21,642 | ||||
| Total Used Powersports Revenue | 40,348 | 80,694 | ||||
| Finance and insurance, net | 6,180 | 19,911 | ||||
| Parts and service and other | 16,075 | 48,297 | ||||
| Total Powersports Revenue | $105,546 | $275,028 | ||||
| Powersports Gross Profit ($000) | ||||||
| Total New Gross Profit | $8,146 | $25,863 | ||||
| Retail (Used) | 3,139 | 9,818 | ||||
| Wholesale (Used) | 3,712 | 3,711 | ||||
| Total Used Gross Profit | 6,850 | 13,529 | ||||
| Finance and insurance, net | 6,180 | 19,911 | ||||
| Parts and service and other | 7,230 | 21,098 | ||||
| Total Powersports Gross Profit | $28,406 | $80,401 |
Powersports Segment, by Sales Channel
| As Reported | Proforma | ||||||
| Q3′ 2021 | Q3′ 2021 | Change YoY (%) | |||||
| Units: Powersports Retailed | |||||||
| New (Retail) | 2,485 | 7,524 | -7% | ||||
| Used (Retail) | 1,336 | 4,044 | 53% | ||||
| Powersport Units Retailed | 3,821 | 11,568 | 8% | ||||
| Revenue: Powersports Retailed ($000) | |||||||
| New (Retail) | $42,943 | $126,126 | 1% | ||||
| Used (Retail) | 19,926 | 59,052 | 105% | ||||
| Revenue: Powersports Retailed | $62,869 | $185,178 | 20% | ||||
| Gross Profit: Powersports Retailed ($000) | |||||||
| New (Retail) | $8,146 | $25,863 | 15% | ||||
| Used (Retail) | $3,139 | $9,818 | 46% | ||||
| Gross Profit: Powersports Retailed | $11,285 | $35,680 | 22% |
| RumbleOn, Inc.Condensed Consolidated Balance Sheets(Unaudited) | ||||||||
| September 30, 2021 | December 31, 2020 | |||||||
| ASSETS | ||||||||
| Current assets: | ||||||||
| Cash | $ | 68,268 | $ | 1,467 | ||||
| Restricted cash | 3,049 | 2,049 | ||||||
| Accounts receivable, net | 42,117 | 9,408 | ||||||
| Inventory | 171,455 | 21,360 | ||||||
| Prepaid expense and other current assets | 4,745 | 3,446 | ||||||
| Total current assets | 289,634 | 37,730 | ||||||
| Property and equipment, net | 58,929 | 6,521 | ||||||
| Right-of-use assets | 92,944 | 5,690 | ||||||
| Goodwill | 263,107 | 26,887 | ||||||
| Intangible assets, net | 303,560 | 46 | ||||||
| Other assets | 3,678 | 105 | ||||||
| Total assets | $ | 1,011,852 | $ | 76,979 | ||||
| LIABILITIES AND STOCKHOLDERS’ EQUITY | ||||||||
| Current liabilities: | ||||||||
| Accounts payable and accrued liabilities | $ | 73,384 | $ | 14,193 | ||||
| Floor plan notes payable | 87,175 | 17,812 | ||||||
| Current portion of convertible debt | 279 | 563 | ||||||
| Current portion of long-term debt | 6,151 | 2,877 | ||||||
| Total current liabilities | 166,989 | 35,445 | ||||||
| Long-term liabilities: | ||||||||
| Senior secured debt | 252,777 | — | ||||||
| Convertible debt, net | 28,648 | 27,166 | ||||||
| Derivative liabilities | 41 | 17 | ||||||
| Notes payable | 567 | 4,691 | ||||||
| Long-term portion of operating lease liabilities | 85,965 | 4,370 | ||||||
| Long-term portion of financing lease liabilities | 40,591 | — | ||||||
| Deferred tax liabilities | 19,579 | — | ||||||
| Other long-term liabilities | 7,765 | 720 | ||||||
| Total long-term liabilities | 435,933 | 36,964 | ||||||
| Total liabilities | 602,922 | 72,409 | ||||||
| Commitments and contingencies (Notes 9, 10, 13, 18) | ||||||||
| Stockholders’ equity: | ||||||||
| Preferred stock, $0.001 par value, 10,000,000 shares authorized, 0 and 0 shares issued and outstanding as of September 30, 2021 and December 31, 2020 | — | — | ||||||
| Class A common stock, $0.001 par value, 50,000 shares authorized, 50,000 shares issued and outstanding as of September 30, 2021 and December 31, 2020 | 0.05 | 0.05 | ||||||
| Class B common stock, $0.001 par value, 100,000,000 shares authorized, 14,881,522 and 2,191,633 shares issued and outstanding as of September 30, 2021 and December 31, 2020 | 15 | 2 | ||||||
| Additional paid-in capital | 548,000 | 108,949 | ||||||
| Accumulated deficit | (134,766 | ) | (104,381 | ) | ||||
| Class B common stock in treasury, at cost 123,089 and 0 shares as of September 30, 2021 and December 31, 2020 | (4,319 | ) | — | |||||
| Total stockholders’ equity | 408,930 | 4,570 | ||||||
| Total liabilities and stockholders’ equity | $ | 1,011,852 | $ | 76,979 |
| RumbleOn, Inc.Condensed Consolidated Statements of Operations(Unaudited) | ||||||||||||||||
| Three-Months Ended September 30 | Nine-Months Ended September 30 | |||||||||||||||
| 2021 | 2020 | 2021 | 2020 | |||||||||||||
| Revenue: | ||||||||||||||||
| Vehicles Sales | ||||||||||||||||
| Powersports | $ | 83,292 | $ | 7,303 | $ | 121,307 | $ | 38,642 | ||||||||
| Automotive | 105,298 | 99,315 | 316,655 | 281,242 | ||||||||||||
| Finance and insurance, net | 6,180 | 199 | 6,998 | 672 | ||||||||||||
| Parts, service and accessories | 16,075 | — | 16,075 | — | ||||||||||||
| Transportation and vehicle logistics | 10,369 | 10,440 | 32,788 | 25,192 | ||||||||||||
| Total revenue | 221,214 | 117,257 | 493,823 | 345,748 | ||||||||||||
| Cost of revenue | ||||||||||||||||
| Powersports | 68,295 | 5,606 | 97,193 | 33,692 | ||||||||||||
| Automotive | 98,773 | 86,473 | 293,751 | 257,046 | ||||||||||||
| Parts, service and accessories | 8,845 | — | 8,845 | — | ||||||||||||
| Transportation and vehicle logistics | 7,914 | 8,374 | 25,958 | 19,325 | ||||||||||||
| Cost of revenue before impairment loss | 183,827 | 100,453 | 425,747 | 310,063 | ||||||||||||
| Impairment loss on automotive inventory | — | — | — | 11,738 | ||||||||||||
| Total cost of revenue | 183,827 | 100,453 | 425,747 | 321,801 | ||||||||||||
| Gross profit | 37,387 | 16,804 | 68,076 | 23,947 | ||||||||||||
| Selling, general and administrative | 37,564 | 13,279 | 69,077 | 42,510 | ||||||||||||
| Stock-based compensation and other issuances | 23,943 | — | 23,943 | — | ||||||||||||
| Insurance recovery | (3,135 | ) | — | (3,135 | ) | (5,615 | ) | |||||||||
| Depreciation and amortization | 1,717 | 536 | 2,948 | 1,567 | ||||||||||||
| Operating income (loss) | (22,702 | ) | 2,989 | (24,757 | ) | (14,515 | ) | |||||||||
| Interest expense | (4,577 | ) | (1,488 | ) | (8,107 | ) | (5,187 | ) | ||||||||
| Forgiveness of PPP loan | 572 | — | 572 | — | ||||||||||||
| Change in derivative liability | (6,518 | ) | (14 | ) | (8,774 | ) | 7 | |||||||||
| Gain on early extinguishment of debt | — | — | — | 188 | ||||||||||||
| Income (Loss) before benefit for income taxes | (33,225 | ) | 1,487 | (41,066 | ) | (19,507 | ) | |||||||||
| Benefit for income taxes | 10,681 | — | 10,681 | — | ||||||||||||
| Net income (loss) | $ | (22,544 | ) | $ | 1,487 | $ | (30,385 | ) | $ | (19,507 | ) | |||||
| Weighted average number of common shares outstanding – basic and fully diluted | 6,939,708 | 2,234,838 | 4,178,932 | 2,165,167 | ||||||||||||
| Net income (loss) per share – basic and fully diluted | $ | (3.25 | ) | $ | 0.67 | $ | (7.27 | ) | $ | (9.01 | ) |
| RumbleOn, Inc.Condensed Consolidated Statements of Cash Flows(Unaudited) | ||||||||
| Nine Months Ended September 30 | ||||||||
| 2021 | 2020 | |||||||
| CASH FLOWS FROM OPERATING ACTIVITIES | ||||||||
| Net loss | $ | (30,385 | ) | $ | (19,507 | ) | ||
| Adjustments to reconcile net loss to net cash (used in) provided by operating activities: | ||||||||
| Depreciation and amortization | 2,948 | 1,568 | ||||||
| Amortization of debt discounts | 2,284 | 1,499 | ||||||
| Forgiveness of PPP loan | (572 | ) | — | |||||
| Share based compensation | 27,165 | 2,425 | ||||||
| Impairment loss on inventory | — | 11,738 | ||||||
| Impairment loss on property and equipment | — | 178 | ||||||
| Loss (gain) from change in value of derivatives | 8,774 | (7 | ) | |||||
| Gain on early extinguishment of debt | — | (188 | ) | |||||
| Deferred taxes | (10,969 | ) | — | |||||
| Changes in operating assets and liabilities: | ||||||||
| Decrease (increase) in prepaid expenses and other current assets | 486 | (1,296 | ) | |||||
| (Increase) decrease in inventory | (33,343 | ) | 34,219 | |||||
| (Increase) in accounts receivable | (6,476 | ) | (2,860 | ) | ||||
| (Increase) decrease in other assets | (3,452 | ) | 63 | |||||
| Increase (decrease) in accounts payable and accrued liabilities | 16,306 | (1,634 | ) | |||||
| Increase in other liabilities | 1,406 | — | ||||||
| (decrease in floor plan trade note borrowings | (3,951 | ) | — | |||||
| Net cash (used in) provided by operating activities | (29,779 | ) | 26,198 | |||||
| CASH FLOWS FROM INVESTING ACTIVITIES | ||||||||
| Cash used for acquisition, net of cash received | (365,946 | ) | — | |||||
| Purchase of property and equipment | (7,613 | ) | (175 | ) | ||||
| Technology development | (1,266 | ) | (1,598 | ) | ||||
| Net cash used in investing activities | (374,825 | ) | (1,773 | ) | ||||
| CASH FLOWS FROM FINANCING ACTIVITIES | ||||||||
| Proceeds from senior secured debt | 261,451 | 8,272 | ||||||
| (Repayments of) proceeds from notes payable | (7,974 | ) | 789 | |||||
| Increase (decrease) in borrowings from non-trade floor plans | 27,688 | (47,211 | ) | |||||
| Net proceeds from PPP loan | — | 5,177 | ||||||
| Net proceeds from sale of common stock | 191,240 | 10,780 | ||||||
| Net cash provided by (used in) financing activities | 472,405 | (22,193 | ) | |||||
| NET INCREASE IN CASH | 67,801 | 2,232 | ||||||
| CASH AND RESTRICTED CASH AT BEGINNING OF PERIOD | 3,516 | 6,726 | ||||||
| CASH AND RESTRICTED CASH AT END OF PERIOD | $ | 71,317 | $ | 8,958 |
| RumbleOn, Inc.Reconciliation of Net Income (Loss) to Adjusted EBITDA | ||||||||||||||||||
| Three-months Ended September 30 | Nine-months Ended September 30 | Pro Forma Three-months Ended September 30 | ||||||||||||||||
| 2021 | 2020 | 2021 | 2020 | 2021 | ||||||||||||||
| Net income (loss) | $ | (22,544 | ) | $ | 1,487 | $ | (30,385 | ) | $ | (19,507 | ) | $ | (3,208) | |||||
| Add back: | ||||||||||||||||||
| Interest expense (including debt extinguishment) | 4,577 | 1,488 | 8,107 | 4,999 | 5,010 | |||||||||||||
| Depreciation and amortization | 1,717 | 536 | 2,948 | 1,567 | 2,180 | |||||||||||||
| Income tax benefit | (10,681 | ) | — | (10,681 | ) | — | (10,681) | |||||||||||
| Change in derivative liabilities | 6,518 | 14 | 8,774 | (7 | ) | 6,518 | ||||||||||||
| EBITDA | (20,413 | ) | 3,525 | (21,237 | ) | (12,948 | ) | (181) | ||||||||||
| Adjustments: | ||||||||||||||||||
| Impairment loss on automotive inventory | — | — | — | 11,738 | ||||||||||||||
| Impairment loss on property and equipment | — | — | — | 178 | ||||||||||||||
| Insurance proceeds | (3,135 | ) | — | (3,135 | ) | (5,615 | ) | (3,135) | ||||||||||
| Stock-based compensation1 | 24,730 | 863 | 26,457 | 2,425 | 24,730 | |||||||||||||
| Acquisition costs associated with the RideNow Transaction | 1,558 | — | 3,515 | — | 1,558 | |||||||||||||
| Other non-recurring costs | 1,448 | 332 | 1,651 | 1,080 | 1,180 | |||||||||||||
| PPP loan forgiveness | (572 | ) | – | (572 | ) | 0 | (572) | |||||||||||
| Adjusted EBITDA | $ | 3,616 | $ | 4,720 | $ | 6,679 | $ | (3,142 | ) | 23,580 | ||||||||
| Less pro forma and other adjustments | (1,351) | |||||||||||||||||
| Pro Forma EBITDA | 22,229 |
(1) Stock based compensation includes the vesting of all then outstanding RSU awards upon the closing of the RideNow Transaction.
Source: RumbleOn, Inc