BRP revenues grow 17 percent in fiscal Q1; Ryker, ATVs lauded

BRP Inc. today reported its financial results for the three-month period ended April 30, 2019. All financial information is in Canadian dollars unless otherwise noted. The complete financial results are available at Sedar, as well as in the Quarterly Reports section of BRP’s website.
“We have experienced strong retail momentum in North America and Europe with all our sectors trending positively, and we are very satisfied with our year-over-year revenue growth of 17%, even while operating in a dynamic environment. We have continued to outpace the competition, and are positive about the outlook for the rest of this year,” declared José Boisjoli, BRP’s president and CEO.
“Our quarter after quarter strong performance is testament to our ability to execute on our strategic priorities : growth, agility and Lean enterprise. With our industry leadership position and our quality of our execution, we are confident to deliver the guidance for the year,” concluded Boisjoli.
Highlights for the Three-Month Period Ended April 30, 2019
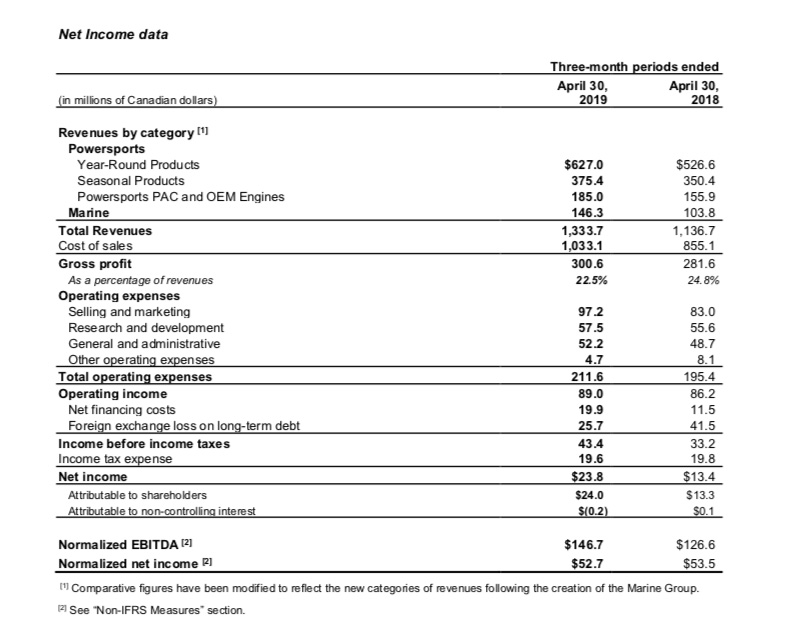
Revenues increased by $197.0 million, or 17.3%, to $1,333.7 million for the three-month period ended April 30, 2019, compared with $1,136.7 million for the corresponding period ended April 30, 2018. The revenue increase was primarily attributable to higher wholesale of Year-Round Products. The increase includes a favourable foreign exchange rate variation of $13 million.
The Company’s North American retail sales for the three-month period ended April 30, 2019 increased by 10% compared with the three-month period ended April 30, 2018, mainly due to an increase in 3WV following the introduction of the Can-Am Ryker.
Gross profit increased by $19.0 million, or 6.7%, to $300.6 million for the three-month period ended April 30, 2019, compared with $281.6 million for the corresponding period ended April 30, 2018. Gross profit margin percentage decreased by 230 basis points to 22.5% from 24.8% for the three-month period ended April 30, 2018. The decrease was primarily due to higher commodity, production and distribution costs and an unfavourable product mix of 3WV sold, partially offset by higher volume of 3WV and PAC sold.


Operating expenses increased by $16.2 million, or 8.3%, to $211.6 million for the three-month period ended April 30, 2019, compared with $195.4 million for the three-month period ended April 30, 2018. The increase was mainly attributable to support for the launch of various products such as the Can-Am Ryker, continued product investments and costs related to the modernization of information systems, partially offset by lower variable employee compensation expenses.
Powersports
Year-Round Products
Revenues from Year-Round Products increased by $100.4 million, or 19.1%, to $627.0 million for the three-month period ended April 30, 2019, compared with $526.6 million for the corresponding period ended April 30, 2018. The increase was primarily attributable to the introduction of the Can-Am Ryker, a higher volume of ATV sold and a favourable foreign exchange rate variation of $9 million.
North American Year-Round Products retail sales increased on a percentage basis in the twenties range compared with the three-month period ended April 30, 2018.
Seasonal Products
Revenues from Seasonal Products increased by $25.0 million, or 7.1%, to $375.4 million for the three-month period ended April 30, 2019, compared with $350.4 million for the corresponding period ended April 30, 2018. The increase resulted primarily from a favourable product mix and price increases in PWC and from a favourable foreign exchange rate variation of $3 million.
North American Seasonal Products retail sales increased on a percentage basis by high-single digits compared with the three-month period ended April 30, 2018.
Powersports PAC and OEM Engines
Revenues from Powersports PAC and OEM Engines increased by $29.0 million, or 18.6%, to $185.3 million for the three-month period ended April 30, 2019, compared with $156.3 million for the corresponding period ended April 30, 2018. The increase was mainly attributable to a higher volume of 3WV, SSV and PWC accessories and a higher volume of snowmobile and PWC parts.
Marine
Revenues from Marine segment increased by $37.9 million, or 33.4%, to $151.3 million for the three-month period ended April 30, 2019, compared with $113.4 million for the corresponding period ended April 30, 2018. The increase was mainly due to the acquisition of Alumacraft BoatCo. (“Alumacraft”) and Triton Industries, Inc. (“Manitou”), partially offset by a lower volume ofoutboard engines sold.
North American outboard engine retail sales decreased on a percentage basis in the high-teens range compared with the three-month period ended April 30, 2018.
DECLARATION OF DIVIDEND
The Board of Directors approved a quarterly dividend of $0.10 per share for holders of its multiple voting shares and subordinate voting shares. The dividend will be paid on July 12, 2019 to shareholders of record at the close of business on June 28, 2019. The payment of each quarterly dividend remains subject to the declaration of that dividend by the Board of Directors. The actual amount, the declaration date, the record date and the payment date of each quarterly dividend are subject to the discretion of the Board of Directors.
Fiscal Year 2020 Guidance
The table below sets forth BRP’s financial guidance for Fiscal Year 2020 which reflects the adoption of new IFRS 16 – Leases (“IFRS 16”) standard effective as of February 1, 2019. Under IFRS 16, operating lease expenses are recorded as depreciation and interest expense rather than operating costs within Normalized EBITDA[1]. No restatement of prior periods was made.
| Financial Metric | FY19 | FY20 Guidance[3] vs FY19 |
| Revenues | ||
| Year-Round Products | $2,240.6 | Up 14% to 19%(previously up to 12% to 17%) |
| Seasonal Products | $1,803.5 | Up 2% to 5%(previously Flat to up 3%) |
| Powersports PAC and OEM Engines | $707.5 | Up 5% to 9%(previously up 2% to 7%) |
| Marine | $492.2 | Up 17% to 22%(previously up 15% to 20%) |
| Total Company Revenues | $5,243.8 | Up 9% to 13%(previously up 7% to 11%) |
| Normalized EBITDA[1] | $655.9 | Up 20% to 23%(previously up 19% to 23%) |
| Effective Tax Rate[1][2] | 25.5% | 26.5% to 27.0% |
| Normalized Earnings per Share – Diluted[1] | $3.10 | Up 15% to 21% ($3.55 to $3.75) (previously $3.50 to $3.70) |
| Net Income | 227.3 | $350M to $375M (assuming an Fx loss on long-term debt and lease liabilities of $27.6M) |
Other guidance:
- Expecting ~$227M Depreciation Expense compared to $176M in FY19, ~$85M of Net Financing Costs Adjusted and~97.5M shares (decreased from 98.2M shares).
- Expecting Capital Expenditures of ~$360M to $370M in FY20 compared to $299M in FY19.