Service contracts show strength at F&I desk
Editor’s note: ADP Lightspeed analyst Hal Ethington, an industry veteran of more than 40 years, provides Powersports Business readers with insight into study on F&I sales over the past year.
ADP Lightspeed study shows year-long sales data
Analysis of more than 648,000 unit sales during the 12 months ended July 2013 reveals the following about finance & insurance products sold with both metric and V-twin new motorcycle purchases:
• Documentation and administrative fees are the charge most often added to a motorcycle deal. They are included in 77 percent of all deals.
• Labor sold on a deal (installs, etc.) showed the greatest increase since 2012, rising $179 to $714 per deal. Prepaid maintenance was second, rising $141 to $1,694 per sale.
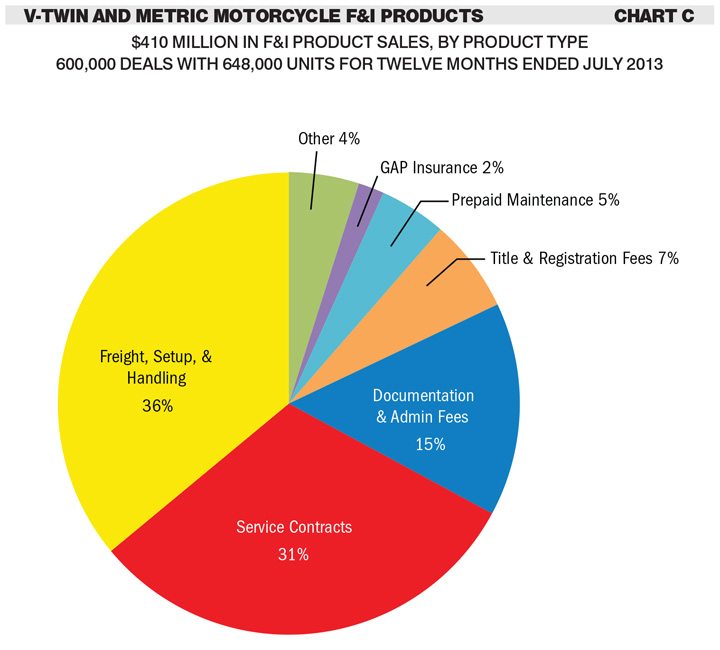
• If freight and setup charges are included with F&I products, they account for the largest portion of F&I sales to units. This charge generated $142 million in sales in the 12 months ended July 2013. Service Contracts, at 31 percent, were next in revenue with $128 million in sales.
F&I products were grouped into 19 major types and compared for the years 2012 and 2013. There was little variance in ranking of penetration between the two years. Labor and prepaid maintenance are still on top, while OEM promotion credits and insurance decreased considerably in size.


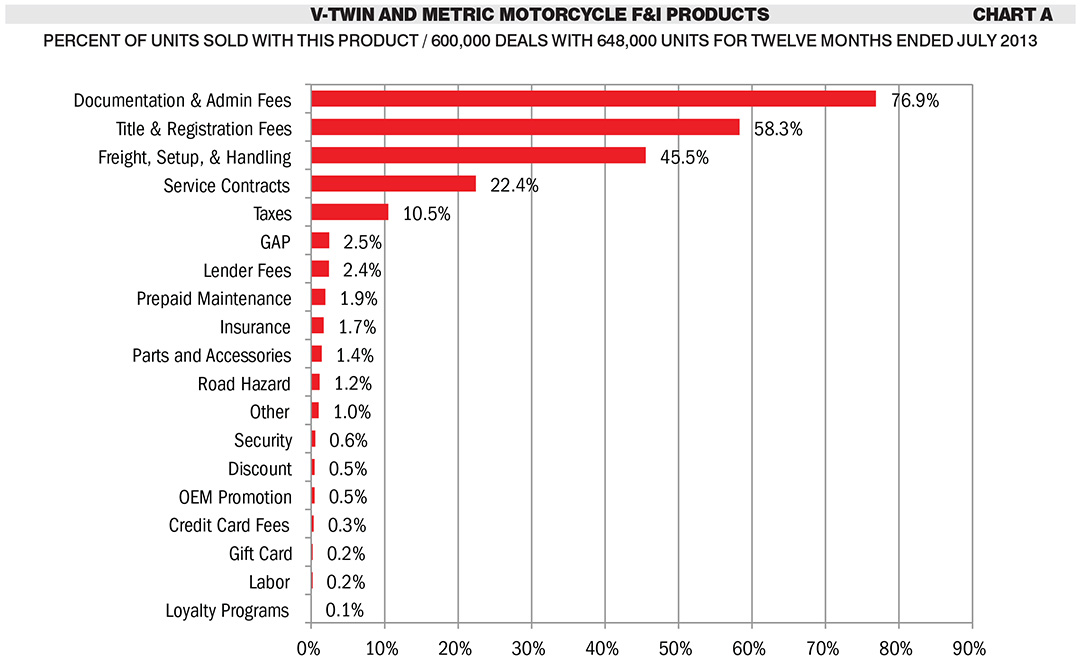
Chart A presents the penetration rate which each of these product groups has reached. The rate is expressed as the percent of units that carried a sale of this product. Doc fees and administrative charges have the highest rate of penetration, with 77 percent of all units carrying this charge. Title and registration were next at 58 percent, followed by freight, setup and handling charges on 46 percent of deals.
Service contracts were sold on 22 percent of units. GAP insurance was seen 2.5 percent of the time; prepaid maintenance was present on 1.9 percent of units, and parts (not sold through the service department on a repair order) were listed on 1.4 percent of units.
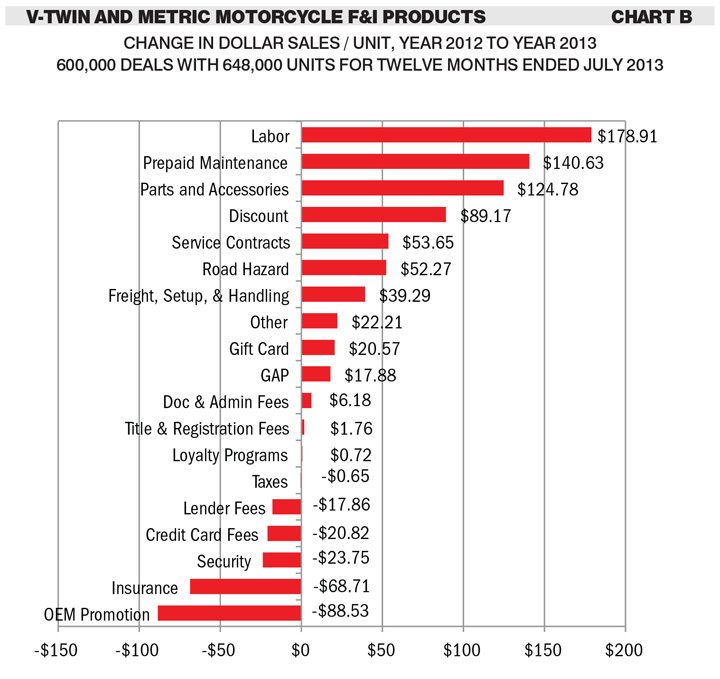
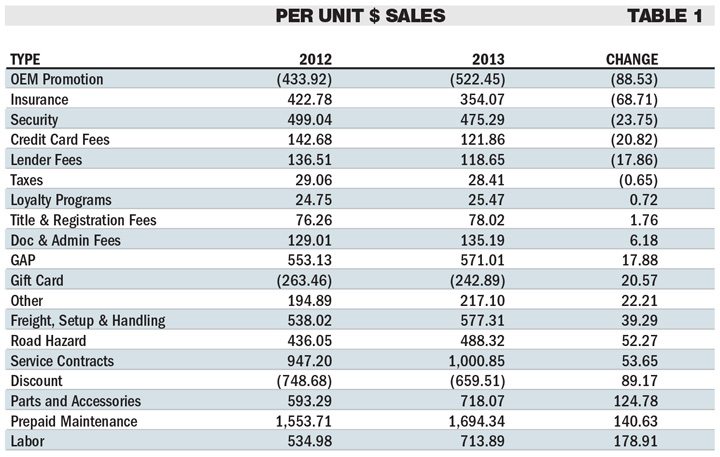
Chart B and Table 1 show the change in average sales per unit for each of the 19 extra line groups. The chart shows labor increasing $179 in 2013, while the table shows the amounts for each of the two years and the difference between them. Surprisingly, sales of security products (etching, alarms etc.) fell $24. Credit card and lender fees also decreased by about $20.
Penetration and average dollars per unit, however, are not an indication of the total effect that these changes have made. Chart C looks at the total revenue returned by each of the 17 groups when the per-unit income is multiplied by the number of units affected. For the year ended July 2013, we see that of the $410 million sold on extra lines, freight and setup accounted for 36 percent. Service contracts are next in size with 31 percent of all extra line income. Doc fees account for 15 percent, and prepaid maintenance contributed 4.7 percent. GAP insurance was barely part of the upper end of sales volume with 1.8 percent of revenue, and surprisingly, road hazard products and insurances were present with 0.8 percent of revenue. All other groups combined accounted for about 10 percent of total F&I sales.
Some of the products mentioned here are more specifically “finance and insurance” than others. Among the top generators, freight and setup would not technically be F&I, neither would parts and accessories or security products. These are actual hardware items that have been added to the deal, but could as easily be classified as a parts sales. However, service contracts, doc fees, prepaid maintenance, GAP insurance and road hazard insurance all are traditional F&I products.
Contract interest participation, a normal F&I product that does produce significant revenue, has not been included in this study. Dealership reporting of this particular item varies widely, and it was not possible to gather reliable data in a uniform manner at this time.
It is clear from this study that service contracts are the driving force in generating F&I revenue. A 50 percent increase in credit card fees will mean little in the overall picture, and would be easily be offset by a less than 0.5 percent drop in service contract revenue. In fact, the irritation factor inherent in a charge for credit card use likely carries a greater risk of driving the customer away than does offering more expensive insurances that would actually have some potential benefit to the buyer.
Dealers would be well advised to pay close attention to the proven heavy lifters of the F&I world: freight and setup, service contracts, doc fees and prepaid maintenance. Because of Internet shopping and resulting low unit margins, solid performance here will carry the department a long way toward the traditional goal of contributing a substantial portion of dealership profit.